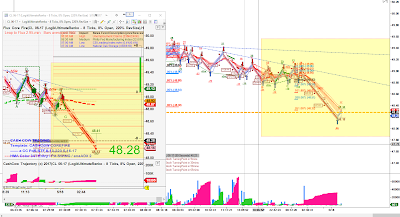
O , this one serves as an almost PERFECT example of Fibonacci's in action. It also demonstrates the aspect of Market Geometry. Observe the Fib level hit, the turn-around and then the market geometry of almost great symmetry before the next ht/pause at $49.00.
BTTF's histogram also delineated the move as analyzed by the software algorithm near 5:50 AM
Target level 161.8 hit near 7:30 am
(green rectangular area) .... (those bloody Englishmen ..... hehe ;)


No comments:
Post a Comment