Well today
was.. a good day.
It validated a lot of things we do.
I hope to share it with those closest to me.
If they don't want to listen, then I also share to whoever reads this blog ... ;)
But once the combo clicks .. enjoy the knowledge while it lasts ..
(I won't Always be here .. ;))
Time's a tickin' .....
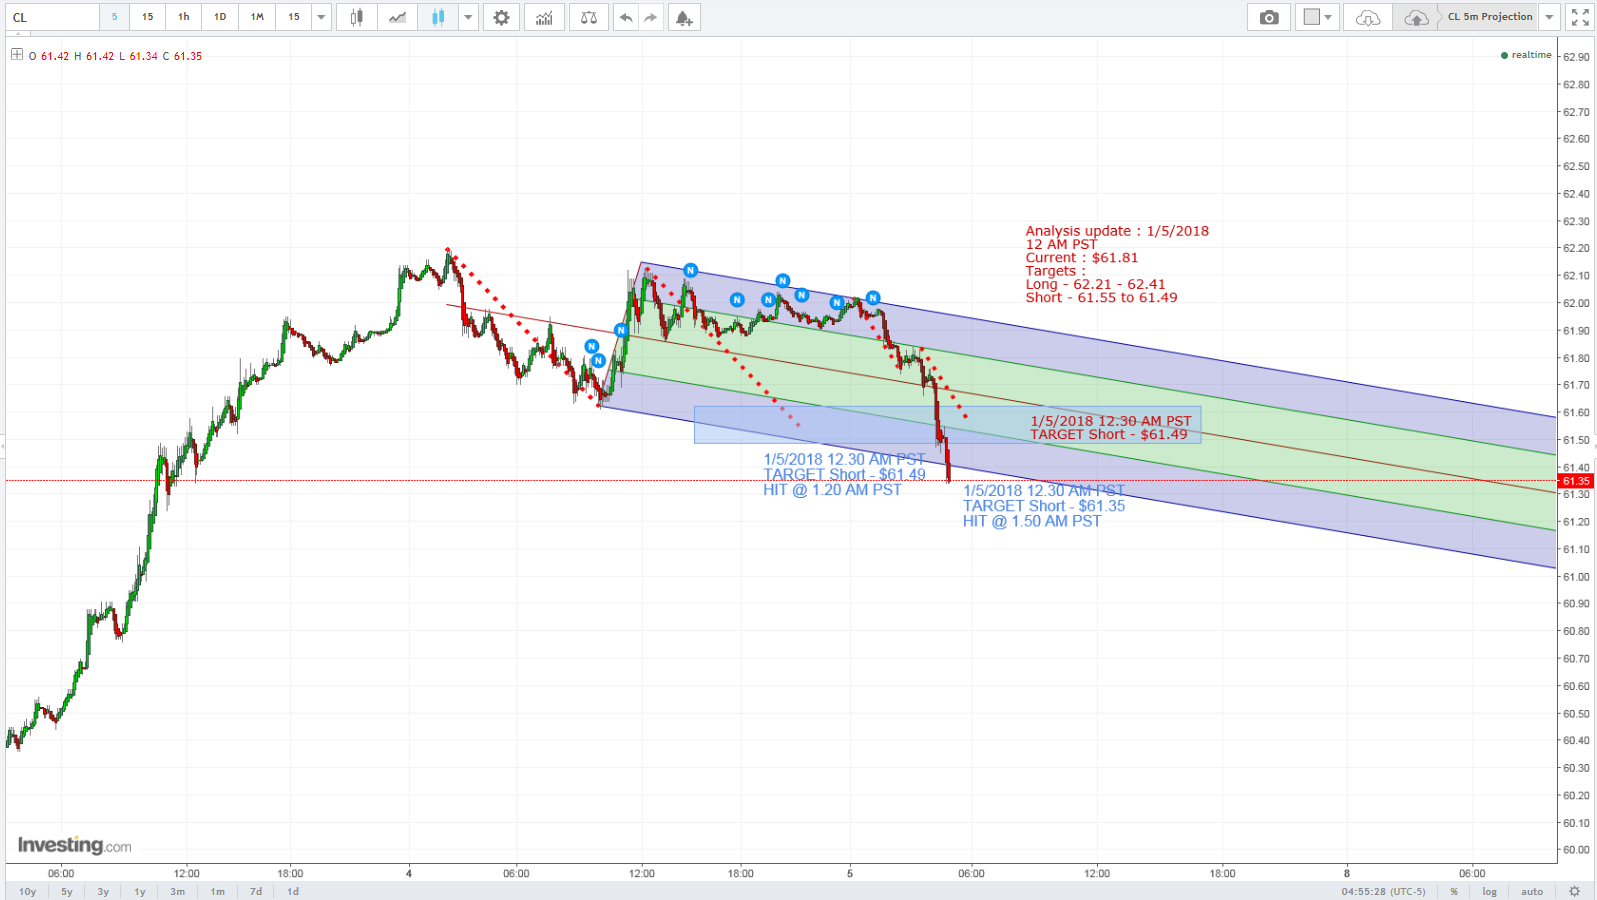
What today entailed was initial analysis done near 12AM just to identify potential levels.
Once we watched the market move, then we adjusted accordingly.
This was based on old-school methods what's known as "Top-Down Approach".
Simply means you look at the same markets from multiple timeframes of TIME.
Higher time frame for base perspective, and then DRILL down to the smaller / lessr timeframe.
3 initial time-frames.
Today we used 5m, 15m and 60m (m=minutes) which is what this chart represents.
https://tvc-invdn-com.akamaized.net/data/tvc_e4743755b7b500ab7bbc07e86803b790.png
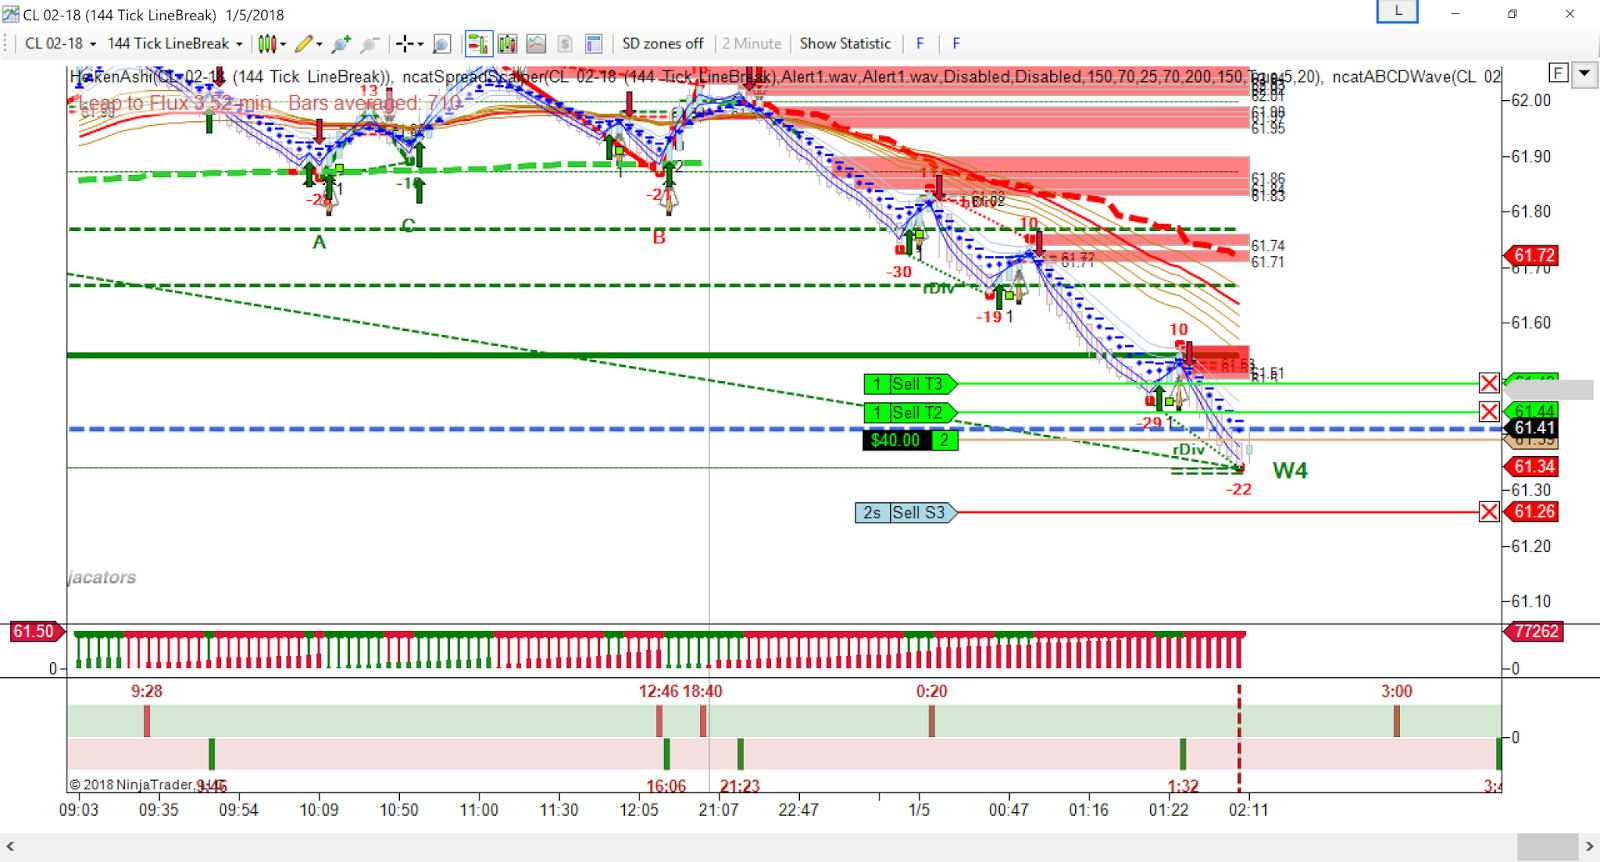
There is analysis done on ALL three time-frames. Each supports and challenges the other ....
While apparently democratic, the higher time frame normally dominates.
The lesser time frames often cater to greater personal gratification.
Utilizing 3, simultaneously
allows us to balance our thought process when markets appear to move strongly on one level, then when checked on the "higher" level, it is a relatively smaller move.
Great for directional understanding.
All levels are based on simple principles of
- Fibonacci
- Elliott Waves
- Cash-Cow Fib Bounces
Keep in mind, though, we engage in scalping, towards longer swing trading,
and targeted projections based on Fibonacci and Elliott Wave levels.
Share your desired trading knowledge, or need,
and we will aim to supply knowledge and info accordingly.
Trade again soon ..... ;)
YkIL !
Check earlier coverage and updates :
http://tradingwiththetrini.blogspot.com/2018/01/cl-analysis-1518-6170-5m.html
TODAY's Daily Tally :
Morning Tally : $680 less $64 commissions.